Difference between revisions of "QPR BusinessPortal Processes View"
| (44 intermediate revisions by 2 users not shown) | |||
| Line 1: | Line 1: | ||
<div style="display: flex;flex-wrap: wrap;"> | <div style="display: flex;flex-wrap: wrap;"> | ||
<div style="flex: 1 0 210px;border:1px solid #dfdfdf;padding:0 1em 1em 1.5em;background-color:#FFFFFF;margin:10px 0px 0px 10px;"> | <div style="flex: 1 0 210px;border:1px solid #dfdfdf;padding:0 1em 1em 1.5em;background-color:#FFFFFF;margin:10px 0px 0px 10px;"> | ||
| − | == | + | == Process Map View == |
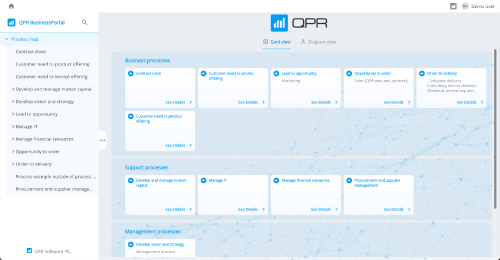
| − | This page presents the | + | This is a starting point in exploring process content. This page presents process content in two alternative views: the '''Card View''' and the '''Diagram View'''. In the Card View, processes are shown as cards, whereas the Diagram View shows the process content exactly as it has been modeled in the modeling tool (QPR ProcessDesigner or QPR EnterpriseArchitect). |
| + | |||
| + | Processes on the top level are often classified within some grouping elements. If this is the case, the view shows the process cards and the name of their grouping element. | ||
| + | |||
| + | All processes can be published from the top of the process hierarchy, or starting from a specific lower-level branch.<br> | ||
[[File:BPProcessesMainPage.png|500px|border|QPR BusinessPortal Processes Main Page]] | [[File:BPProcessesMainPage.png|500px|border|QPR BusinessPortal Processes Main Page]] | ||
| + | |||
| + | |||
| + | You can drill down to a lower process level by clicking on a process card or by navigating to a lower level using the process hierarchy ('''Sider''') on the left-hand side. You can also see the process details by clicking '''See Details''', or switch to the '''Diagram View'''. | ||
| + | <syntaxhighlight lang="text"> | ||
| + | Modeling tool settings: | ||
| + | Grouping elements are elements for which the behavior "Group element" is ticked. | ||
| + | The elements nested within the grouping elements must have the "Can belong to a group" behavior ticked. | ||
| + | Grouping elements can be nested within grouping elements if both "Grouping element" and "Can belong to a group" are ticked.<br> | ||
| + | All elements that have the diagram behavior ticked also show in the diagram / process hierarchy | ||
| + | </syntaxhighlight> | ||
</div> | </div> | ||
</div> | </div> | ||
| Line 11: | Line 25: | ||
== Card View == | == Card View == | ||
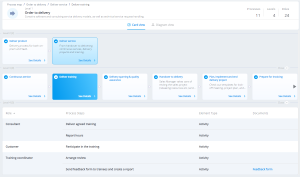
| − | The Card | + | The Card View visualizes the processes modeled in QPR ProcessDesigner / QPR EnterpriseArchitect as cards. A card shows the name of the process and its description. |
| + | |||
| + | The cards on any given level can be browsed sideways by using the black carousel arrows. | ||
| + | |||
| + | By clicking a card, lower-level process content becomes visible. Process details can be viewed by clicking '''See Details'''. | ||
| + | |||
| + | If a process level does not contain diagram elements, contents are visualized in a '''Process Flowchart Table''' instead of card components. | ||
| + | |||
| + | If a process does not contain any modeling elements (or if there are connectors only), it cannot be clicked. This is indicated to users by showing the card in greyscale. | ||
| + | |||
| + | Since the Card View displays many process levels at once, each process level is separated by a divider that states the number of the process level and in parentheses, how many processes are on the given level. The process level can be closed by clicking on the divider's '''X icon'''. | ||
| − | + | [[File:Card view.png|alt=Card view|thumb|none|Card view]] | |
| + | <syntaxhighlight lang="text"> | ||
| + | Modeling tool settings: | ||
| + | Diagram elements are shown as cards. | ||
| + | Diagram elements refer to elements that have the diagram behavior ticked. | ||
| + | Please note, that diagram elements are also shown in the diagram/process hierarchy. | ||
| + | </syntaxhighlight>Please note that if there are process levels with both diagram elements and elements without diagram behavior, QPR BusinessPortal will only publish diagram elements. Support for such mixed process levels will be developed later. | ||
</div> | </div> | ||
| Line 19: | Line 49: | ||
== Diagram View == | == Diagram View == | ||
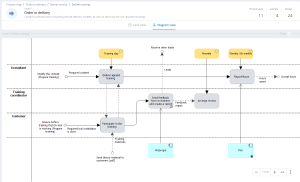
| − | + | The Diagram View simply shows the diagram view of the selected process. Clicking on a diagram element drills down to show the diagram view of the selected element – the view contents and URL update accordingly. You can scroll up to see the higher-level process level(s). | |
| + | |||
| + | Since the Diagram View displays many process levels at once, each process level is separated by a divider that states the number of the process level and the name of the process. Scrolling up unveils higher-level process diagrams. The process level can be closed by clicking on the divider’s '''X icon'''. | ||
| + | If a diagram element does not contain any elements (or if there are connectors only), it cannot be clicked. This is indicated to the user by the mouse pointer remaining an arrow (instead of turning into a hand). | ||
| + | |||
| + | The diagram contents and layout come from QPR's modeling tools and are displayed exactly as modeled in QPR ProcessDesiner / QPR EnterpriseArchitect. If the layout or contents of the diagram need to be changed, the changes need to be made in the modeling tool. | ||
| + | |||
| + | [[File:Diagram view.png|alt=Diagram view|thumb|none|Diagram view]] | ||
| + | <syntaxhighlight lang="text"> | ||
| + | Modeling tool settings: | ||
| + | Diagram elements refer to elements that have the diagram behavior ticked. | ||
| + | </syntaxhighlight> | ||
</div> | </div> | ||
</div> | </div> | ||
| + | |||
<div style="display: flex;flex-wrap: wrap;"> | <div style="display: flex;flex-wrap: wrap;"> | ||
<div style="flex: 1 0 210px;border:1px solid #dfdfdf;padding:0 1em 1em 1.5em;background-color:#FFFFFF;margin:10px 0px 0px 10px;"> | <div style="flex: 1 0 210px;border:1px solid #dfdfdf;padding:0 1em 1em 1.5em;background-color:#FFFFFF;margin:10px 0px 0px 10px;"> | ||
| − | == | + | === Process Flowchart Table === |
| + | The Process Flowchart Table shows the contents of the lowest process level. Default columns are Role, Process Steps, Process Step Type, and Documents. Each column header features a small arrow, which can be clicked to sort the contents of the column in ascending or descending order. | ||
| + | |||
| + | The Process Flowchart Table is shown in the '''Card View''' and the '''Details View'''. | ||
| + | <syntaxhighlight lang="text"> | ||
| + | Modeling tool settings: | ||
| + | When a process level does not have any elements with diagram behavior (it is the lowest process level), contents are shown in the process flowchart table. | ||
| + | Only process step type elements are shown in the table (system types and element types are excluded). | ||
| + | Role refers to swimlanes and Documents refer to information items. | ||
| + | </syntaxhighlight> | ||
| + | </div> | ||
| + | </div> | ||
| + | |||
<div style="display: flex;flex-wrap: wrap;"> | <div style="display: flex;flex-wrap: wrap;"> | ||
| − | The | + | <div style="flex: 1 0 210px;border:1px solid #dfdfdf;padding:0 1em 1em 1.5em;background-color:#FFFFFF;margin:10px 0px 0px 10px;"> |
| + | |||
| + | === Details View === | ||
| + | To see process details, click '''See Details''' on the process card. The Details View shows the name of the process, its description, selected default attributes (Owner and Documents), the "Inputs and Outputs" graph, and lower-level process information in table(s). If the process in question contains both diagram elements (e.g., Business Processes in ODM, Sub-Processes in BPMN) and non-diagram elements (e.g., Activities in ODM, Tasks in BPMN), they are shown in separate tables. | ||
| + | |||
| + | The Details View can be closed either by clicking outside the view box or by clicking the close button at the top right corner of the view box or at the the bottom. | ||
| + | |||
| + | <syntaxhighlight lang="text"> | ||
| + | Modeling tool settings: | ||
| + | Diagram elements refer to elements that have the diagram behavior ticked. These types of elements are usually used at the top and intermediate process levels. | ||
| + | Elements that do not have the diagram behavior ticked are usually used at the lowest process level. | ||
| + | Documents refer to Information Items. | ||
| + | </syntaxhighlight> | ||
| + | </div> | ||
</div> | </div> | ||
<div style="display: flex;flex-wrap: wrap;"> | <div style="display: flex;flex-wrap: wrap;"> | ||
| − | + | <div style="flex: 1 0 210px;border:1px solid #dfdfdf;padding:0 1em 1em 1.5em;background-color:#FFFFFF;margin:10px 0px 0px 10px;"> | |
| + | |||
| + | == Sider == | ||
| + | <div style="display: flex;flex-wrap: wrap;"> | ||
| + | The Sider on the left side of the screen shows the process hierarchy. It is automatically generated with diagram elements, same as in QPR ProcessDesigner / QPR EnterpriseArchitect. | ||
</div> | </div> | ||
<div style="display: flex;flex-wrap: wrap;"> | <div style="display: flex;flex-wrap: wrap;"> | ||
| − | The Sider can be resized, | + | [[File:BPSider.png|250px|border|right|QPR BusinessPortal Sider]]<br> |
| − | </div> | + | You can expand the hierarchy by clicking the small arrows. Clicking on a process on the hierarchy will select that process and update the '''Card View''' and '''Diagram View''' to show the contents of that process. Selected process and path are highlighted in the process hierarchy. |
| + | |||
| + | The search feature is activated by clicking the magnifying glass at the top of the sider. By typing in a word in the search field, the search looks for all processes with that word. | ||
| + | The Sider can be horizontally resized, collapsed, and expanded using the small tab on the right of the Sider.<syntaxhighlight lang="text"> | ||
| + | Modeling tool settings: | ||
| + | The sider is automatically generated of elements that have the diagram behavior ticked. | ||
| + | </syntaxhighlight></div> | ||
</div> | </div> | ||
| Line 42: | Line 119: | ||
== Page Header == | == Page Header == | ||
| − | The Page Header shown | + | The Page Header shown at the top of the Card / Diagram view displays statistics about the selected process branch - how many processes belong to the branch, on how many levels, and how many unique roles are featured.<br> |
[[File:BPPageHeader.png|500px|border|Processes View Page Header]]<br> | [[File:BPPageHeader.png|500px|border|Processes View Page Header]]<br> | ||
| − | The Page Header also contains buttons to switch between the Card View and the Diagram View. | + | The Page Header also contains buttons to switch between the '''Card View''' and the '''Diagram View'''. |
| − | < | + | <syntaxhighlight lang="text"> |
| − | + | Modeling tool settings: | |
| − | + | The processes statistic counts diagram elements, as these are usually used for higher-level processes. Lower-level process flow elements (non-diagram elements) are left out. | |
| − | + | Levels counts the maximum number of process levels that the process branch features. | |
| − | + | Roles counts the number of unique roles (swimlanes) present in all of the processes present in the branch. | |
| − | + | </syntaxhighlight></div> | |
| − | </div> | ||
</div> | </div> | ||
| + | |||
<!-- | <!-- | ||
Latest revision as of 07:38, 22 September 2023
Process Map View
This is a starting point in exploring process content. This page presents process content in two alternative views: the Card View and the Diagram View. In the Card View, processes are shown as cards, whereas the Diagram View shows the process content exactly as it has been modeled in the modeling tool (QPR ProcessDesigner or QPR EnterpriseArchitect).
Processes on the top level are often classified within some grouping elements. If this is the case, the view shows the process cards and the name of their grouping element.
All processes can be published from the top of the process hierarchy, or starting from a specific lower-level branch.

You can drill down to a lower process level by clicking on a process card or by navigating to a lower level using the process hierarchy (Sider) on the left-hand side. You can also see the process details by clicking See Details, or switch to the Diagram View.
Modeling tool settings:
Grouping elements are elements for which the behavior "Group element" is ticked.
The elements nested within the grouping elements must have the "Can belong to a group" behavior ticked.
Grouping elements can be nested within grouping elements if both "Grouping element" and "Can belong to a group" are ticked.<br>
All elements that have the diagram behavior ticked also show in the diagram / process hierarchy
Card View
The Card View visualizes the processes modeled in QPR ProcessDesigner / QPR EnterpriseArchitect as cards. A card shows the name of the process and its description.
The cards on any given level can be browsed sideways by using the black carousel arrows.
By clicking a card, lower-level process content becomes visible. Process details can be viewed by clicking See Details.
If a process level does not contain diagram elements, contents are visualized in a Process Flowchart Table instead of card components.
If a process does not contain any modeling elements (or if there are connectors only), it cannot be clicked. This is indicated to users by showing the card in greyscale.
Since the Card View displays many process levels at once, each process level is separated by a divider that states the number of the process level and in parentheses, how many processes are on the given level. The process level can be closed by clicking on the divider's X icon.
Modeling tool settings:
Diagram elements are shown as cards.
Diagram elements refer to elements that have the diagram behavior ticked.
Please note, that diagram elements are also shown in the diagram/process hierarchy.
Diagram View
The Diagram View simply shows the diagram view of the selected process. Clicking on a diagram element drills down to show the diagram view of the selected element – the view contents and URL update accordingly. You can scroll up to see the higher-level process level(s).
Since the Diagram View displays many process levels at once, each process level is separated by a divider that states the number of the process level and the name of the process. Scrolling up unveils higher-level process diagrams. The process level can be closed by clicking on the divider’s X icon.
If a diagram element does not contain any elements (or if there are connectors only), it cannot be clicked. This is indicated to the user by the mouse pointer remaining an arrow (instead of turning into a hand).
The diagram contents and layout come from QPR's modeling tools and are displayed exactly as modeled in QPR ProcessDesiner / QPR EnterpriseArchitect. If the layout or contents of the diagram need to be changed, the changes need to be made in the modeling tool.
Modeling tool settings:
Diagram elements refer to elements that have the diagram behavior ticked.
Process Flowchart Table
The Process Flowchart Table shows the contents of the lowest process level. Default columns are Role, Process Steps, Process Step Type, and Documents. Each column header features a small arrow, which can be clicked to sort the contents of the column in ascending or descending order.
The Process Flowchart Table is shown in the Card View and the Details View.
Modeling tool settings:
When a process level does not have any elements with diagram behavior (it is the lowest process level), contents are shown in the process flowchart table.
Only process step type elements are shown in the table (system types and element types are excluded).
Role refers to swimlanes and Documents refer to information items.
Details View
To see process details, click See Details on the process card. The Details View shows the name of the process, its description, selected default attributes (Owner and Documents), the "Inputs and Outputs" graph, and lower-level process information in table(s). If the process in question contains both diagram elements (e.g., Business Processes in ODM, Sub-Processes in BPMN) and non-diagram elements (e.g., Activities in ODM, Tasks in BPMN), they are shown in separate tables.
The Details View can be closed either by clicking outside the view box or by clicking the close button at the top right corner of the view box or at the the bottom.
Modeling tool settings:
Diagram elements refer to elements that have the diagram behavior ticked. These types of elements are usually used at the top and intermediate process levels.
Elements that do not have the diagram behavior ticked are usually used at the lowest process level.
Documents refer to Information Items.
Sider
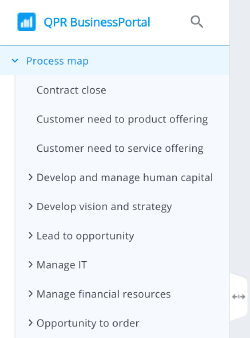
The Sider on the left side of the screen shows the process hierarchy. It is automatically generated with diagram elements, same as in QPR ProcessDesigner / QPR EnterpriseArchitect.
You can expand the hierarchy by clicking the small arrows. Clicking on a process on the hierarchy will select that process and update the Card View and Diagram View to show the contents of that process. Selected process and path are highlighted in the process hierarchy.
The search feature is activated by clicking the magnifying glass at the top of the sider. By typing in a word in the search field, the search looks for all processes with that word.
The Sider can be horizontally resized, collapsed, and expanded using the small tab on the right of the Sider.Modeling tool settings:
The sider is automatically generated of elements that have the diagram behavior ticked.
Page Header
The Page Header shown at the top of the Card / Diagram view displays statistics about the selected process branch - how many processes belong to the branch, on how many levels, and how many unique roles are featured.

The Page Header also contains buttons to switch between the Card View and the Diagram View.
Modeling tool settings:
The processes statistic counts diagram elements, as these are usually used for higher-level processes. Lower-level process flow elements (non-diagram elements) are left out.
Levels counts the maximum number of process levels that the process branch features.
Roles counts the number of unique roles (swimlanes) present in all of the processes present in the branch.


