Difference between revisions of "QPR Impact Analysis"
| Line 107: | Line 107: | ||
For every node there is a QPR Web Service query of which outcome is changed to a list of element pairs (element ID’s). The two parts of the pair are called '''''left''''' and '''''right'''''. Table 1 presents how left and right are determined based on whether the attributes connectionToPrevious and connectionToNext are defined in the node. | For every node there is a QPR Web Service query of which outcome is changed to a list of element pairs (element ID’s). The two parts of the pair are called '''''left''''' and '''''right'''''. Table 1 presents how left and right are determined based on whether the attributes connectionToPrevious and connectionToNext are defined in the node. | ||
| − | [[File: | + | [[File:5 Functioning principle.PNG]] |
Element pairs of the nodes are connected according to the Figure 2 to form the final report. The result is likewise a list of element pairs which is the final report. | Element pairs of the nodes are connected according to the Figure 2 to form the final report. The result is likewise a list of element pairs which is the final report. | ||
| − | [[File: | + | [[File:Figure 3..PNG]] |
Revision as of 09:30, 15 June 2017
Contents
- 1 Purpose of the reporting feature 3
- 2 Reporting platform installation 3
- 3 Configuration of reports 4
- 4 Running reports and linking to them 8
- 5 Functioning principle 9
1 Purpose of the Reporting Feature
Impact Analysis is a reporting platform to build reports to visualize relations between entities. These connections come through several relations, which are:
- relations made with connectors
- relation type custom attributes
- system relations (for example activities and organization units, or activities and information elements)
To run the Impact Analysis reports you need first to
- 1. install the Impact Analysis platform (see chapter 2)
- 2. design the reports (see chapter 3)
Configuration of the reports are stored in an EA/PD model. There are two strategies to set up the configuration:
- Global configuration model: There is one configuration model for the whole QPR system. The report gets the available reports from this configuration model.
- Local configuration model: The configuration is read from the model itself which is currently open. Alternatively the configuration model can be supplied as a parameter to the report.
Variable USE GLOBAL CONFIGURATION MODEL determines the used configuration strategy (see next chapter). Impact Analysis also supports gap analysis. The gap analysis compares two Impact Analysis reports and displays differences between them, i.e. which connections have been deleted and which are new.
2 Reporting platform installation
Here are the installation instructions for a technical expert. Instructions may need to be adjusted depending on the installation environment.
- 1. Take backup copies of your existing templates and web content.
- 2. Copy the contents of the Templates folder to the WAS subfolder in your templates folder of your instance, e.g. C:\ProgramData\QPR Software\QPR 2017\2017.1\Servers\Templates\WAS\
- 3. Copy the contents of the Web server folder to qprsoftware folder under the web content root folder, e.g. *C:\inetpub\wwwroot\qpr2017-1\qprsoftware\
- 4. Save the file model QPR ODM – Impact Analysis Support.qpream as a QPR server model. (for a global configuration model or as an example for reports configurations)
- 5. In impactanalysis.tpl configure the variables
 a.	USE_GLOBAL_CONFIGURATION_MODEL (is there one configuration model for the whole system)
 b.	REPORT_CONFIGURATION_MODEL (configuration model ID)
 c.	REPORT_CONFIGURATION_ELEMENTTYPE (report element type)
 d.	OUTPUT_DATE_FORMAT (date format for representing dates in the report)
 e.	NUMBER_FORMAT_LOCALE (locale for formatting numeric values; available locales http://code.google.com/p/jquery-numberformatter)
- 6. Restart QPR service or clear WAS template cache.
3 Configuration of Reports
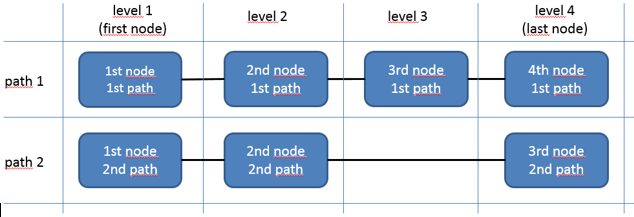
Impact Analysis is based on the following concepts (see Figure 1):
- element set: A set of PD/EA elements (or elements instances). Set implies that the order of element doesn’t matter and an element can only be once in the set.
- node: An element set configured in the report. It is connected to a previous or next element set through a PD/EA relation.
- path: A chain of nodes that are in connection through relations. A path always contain a first node and last node. One report may have connections made with several paths.
- level: The order number of the first path nodes from left to right. For other paths it must be defined which levels the nodes are belonging to.
Figure 1. Impact analysis report concepts visualized.
The report configuration is made in a PD/EA model where elements of type Report represent reports. The Report elements have the following attributes:
When using gap analysis, both left and right side models must be included in the report. In addition, note that the gap analysis only compares connections between the first and last node, and it doesn’t take into account any differences in the middle of the path. Also, the gap analysis doesn’t show any differences when properties of elements have been changes (e.g. element name), only connections between elements matter. For comparing changes in element attributes, use the Model comparison function (http://kb.qpr.com/qpr2017-1/model_comparison.htm).
The inner array of connections attribute lists all nodes of a single path. Items of this array have the following attributes:File:Forming element group in the node.PNG
File:Connections between nodes.PNG
File:Report header labels (only defined for the first node).PNG
Data for different data types is defined in the following way:
- string: attribute is in quotation marks, e.g. "this is a string"
- boolean: alternatives are true or false (without any quotation marks)
- integer: defined as a bare number, e.g. 5
- array: attribute is defined in square brackets [] separated by commas, e.g. array of strings ["string one", "string two", "string three"]
QPR Web Service supports e.g. the following relation names (i.e. they can be used as connectionToPrevious and connectionToNext attributes):
- elements and process steps (and their instances): incomingflows, outgoingflows, parentobjects, organizationunit, notes
- connectors: to, from, toinstance, frominstance
- all type of objects: informationitems, owner, [relation attribute names]
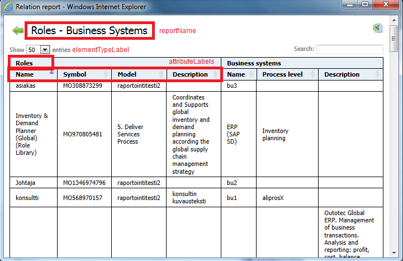
Figure 2. Example of a report.
4 Running reports and linking to them
- 1. Open QPR Portal and Processes > Analysis -tab.
- 2. Click Impact Analysis button.
- 3. On the pop-up window, choose a report and the model(s) which content you wish to run through that report.
- 4. The report enables:
 a.	Filter content with search functionality found on the top right corner.
 b.	Sort report content by clicking column headers.
 c.	Return to report selection window by clicking the “return” arrow on the top left corner.
 d.	Prepare content for copying to Excel by clicking the Excel button on the top right corner.
It is also possible to provide an URL-address for the report. Get link -button displays a link to the report with selected information (report & model(s)).
The link includes following parameters:
5 Functioning principle
For every node there is a QPR Web Service query of which outcome is changed to a list of element pairs (element ID’s). The two parts of the pair are called left and right. Table 1 presents how left and right are determined based on whether the attributes connectionToPrevious and connectionToNext are defined in the node.
File:5 Functioning principle.PNG
Element pairs of the nodes are connected according to the Figure 2 to form the final report. The result is likewise a list of element pairs which is the final report.

