QPR Google Analytics
QPR Portal Usage Reporting Powered by Google Analytics
Overview
This technical solution implements QPR Portal usage tracking and reporting using Google Analytics. The solution can be used to analyze QPR portal usage to answer e.g. following questions:
- What content is viewed (process models, process levels)
- What kind of views has been used, e.g. flow chart or navigator
- Which users have been most active
- What portal functionality has been used, such as full screen, zooming, bookmarks.
- Which external links and information items has been opened.
Google Analytics tracking records Page views and Events. A page view occurs when content is opened, e.g. process chart or navigator view. Event occurs when a button in portal is clicked, e.g. full screen.
Using Google Analytics requires installing QPR Portal customizations.
More information related to Google Analytics:
- Google Analytics web site: http://www.google.com/analytics/
- Google Analytics technical instructions: https://developers.google.com/analytics/devguides/collection/analyticsjs/
Page views
Following information is reported to Google Analytics in page views:
- Page: Model name and full process level path (or scorecard path)
- Title: main tab and sub tab, such as “Processes/Process Maps”
- Dimension1: User full name
- Dimension2: View name
- Dimension3: Model name
- Dimension4: Scorecard name (applies only to Metrics)
- Dimension5: Element name
Events
Events are reported with following information:
- Event category: “button”
- Event action: name describing which button was clicked
- Event label: empty
Events are reported when e.g. following buttons are clicked: Select model, Print, Bookmark, Add to Basket, Export to Excel, Export to PowerPoint, Full screen, Graph Settings, Views.
Note that the reporting to Google Analytics is done when a button is clicked – not when e.g. a bookmark is saved or a model selected.
Also when information items or custom urls are opened an event is reported with following information:
- Event category: “External URL”
- Event action: “Open”
- Event label: External URL itself or embedded file name
User (dimension1) is valid with all the events.
Installation
Follow these steps to install portal usage reporting:
- Configure Google Analytics #Adding Custom Dimensions in Google Analytics for QPR Portal
- Install the template changes and replace utils.js with the modified version
- Take backup copies of your existing templates
- Copy the contents of the Templates folder to the WAS subfolder in your templates folder of your instance, e.g. C:\ProgramData\QPR Software\QPR 2019\2019.1\Servers\Templates\WAS\
- Copy the contents of the Web server folder to qprsoftware folder under the web content root folder, e.g. C:\inetpub\wwwroot\qpr2019-1\qprsoftware\
- Restart QPR servers or clear WAS template cache
- Get a Tracking id from Google Analytics site, and place it in mainview.tpl in line containing var googleAnalyticsTrackingCode = "UA-XXXXXXXX-Y"; in place of UA-XXXXXXXX-Y
- Set other configuration parameters (#Configuration parameters)
- Clear QPR Portal template cache
- Test that the reporting works and that there are no JavaScript errors when using QPR Portal
Configuration parameters
All configuration parameters are saved in mainview.tpl. Following exists:
- googleAnalyticsTrackingCode: Google Analytics tracking code, more information https://support.google.com/analytics/answer/1008080?hl=en
- googleAnalyticsDebugMode: see #Debug mode
- enableUserNameReporting: Is used to enable or disable user full name sending to Google because of information security concerns. Note that, even if it is disabled, the parameter1 must still have to be defined in GA site configuration.
Disabling Google Analytics
Google Analytics tracking is disabled when no Google Analytics tracking code is defined in googleAnalyticsTrackingCode.
Debug mode
Google Analytics integration can be switched to debug mode, in which all the reports to Google Analytics (page views and events) are showed in popup messages in QPR Portal. In the debug mode it is possible to see what information is reported to Google Analytics and when.
Debug mode is switched on by changing javascript variable googleAnalyticsDebugMode to “true” instead of “false” in mainview.tpl (in Portal folder). After that QPR Portal template cache must be cleared.
Google Analytics - Data collection principles
Technology
Google Analytics is implemented with "page tags". In Google Analytics, a page tag is called the Tracking Code which is JavaScript code that the website owner adds to every page of the website. This code has been modified by QPR to allow wider reporting capabilities and to function in the QPR Portal environment. The tracking code runs in the visitor’s browser and collects visitor data and sends it to a Google data collection server as part of a request for a web beacon.
The tracking code sets first party cookies on visitor's computer. These cookies store anonymous information such as whether the visitor has been to the site before (new or returning visitor), the timestamp of the current visit, and the referrer site or campaign that directed the visitor to the page.
Limitations
Ad filtering programs and extensions (such as Firefox's Adblock and NoScript) can block the Google Analytics Tracking Code. This prevents some traffic and users from being tracked, and may lead to holes in the collected data. JavaScript needs to be available and enabled in the browser.
Blocking or deleting Google Analytics cookies may impact data accuracy. Without cookies being set, Google Analytics cannot collect data.
Google Analytics uses sampling in generation of some of its reports. Google Analytics limits reports to 500,000 randomly sampled visits at the profile level for its calculations.
Privacy
Whenever someone visits a website that uses Google Analytics, if JavaScript is enabled in the browser, then Google tracks that visit via the user's IP address in order to determine the user's approximate geographic location. However, the IP address is not shown on any reports as it is against the Google Analytics privacy policy to store personally identifiable information.
Adding custom Dimensions in Google Analytics for QPR Portal
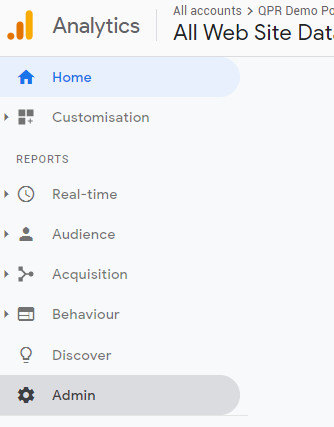
1. Login or register to Google Analytics site, and configure a new Property in admin section
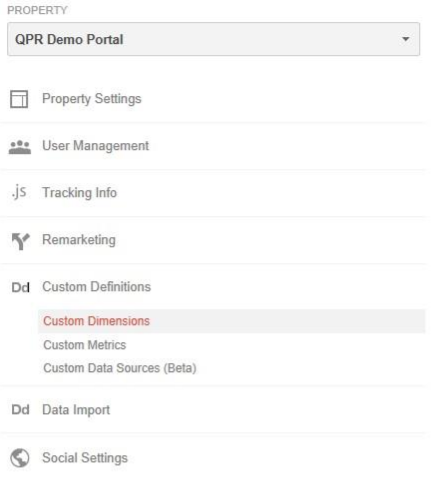
2. Configure the needed dimensions (dimension 1-5)
Custom reports
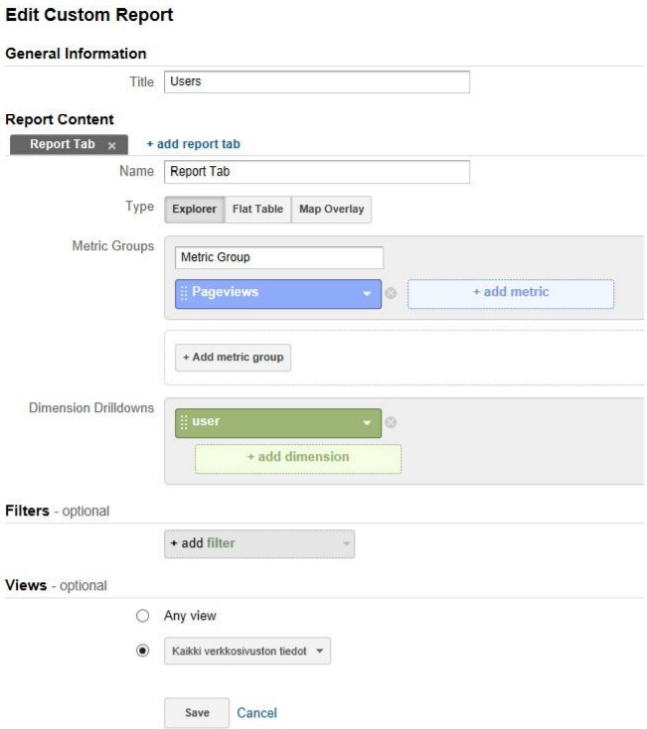
“Users” report
1. Customization → Custom Reports
2. Change the values according to the image below and click “save”: Note: Metrics may be altered according to reporting needs; “Pageviews” is the essential metric in this report. Such as “Avg. visit duration” or “Pages / Visit” may be of use.


