Tutorial: Creating View in QPR UI
Creating a New MobileDashboard View:
Define View Properties and Context
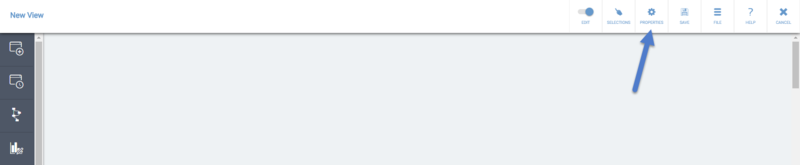
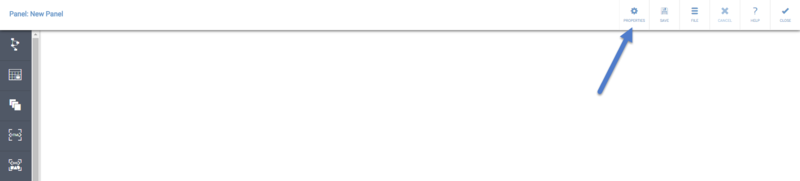
- Creating a new QPR MobileDashboard view starts by defining the Name, Description, and View Context. These are defined in the view properties that is opened by clicking the Properties button:
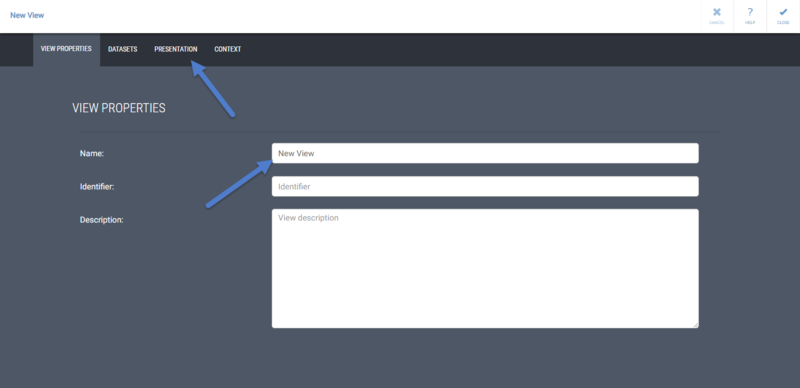
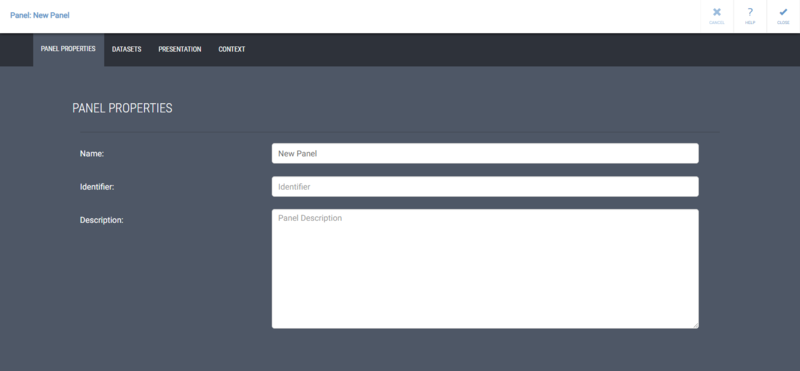
- First, give your view a Name and a Description. Then, click Context:
- The context defines the starting points for later querying data from QPR EnterpriseArchitect/ProcessDesigner, QPR Metrics, and/or QPR ProcessAnalyzer. Define the context by selecting values for the context variables by first selecting a variable from the drop-down menu and then tapping the edit icon on the Value column:
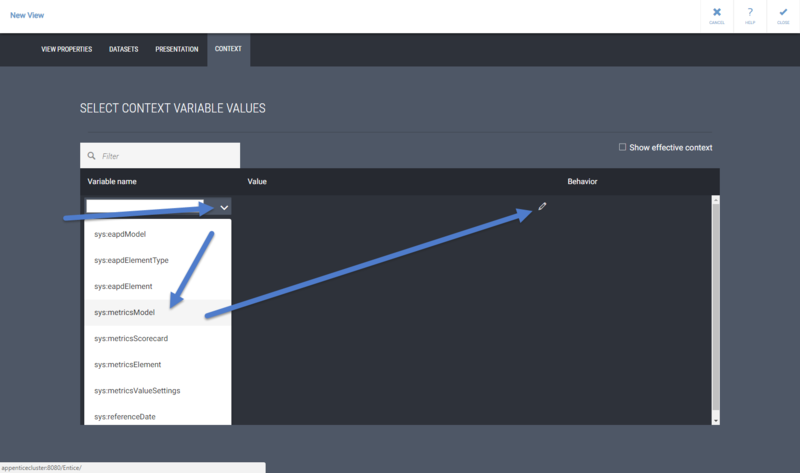
The available context variables are:- sys:eapdModel: QPR EnterpriseArchitect/ProcessDesigner model.
- sys:eapdElementType: QPR EnterpriseArchitect/ProcessDesigner element type that exists in the defined QPR EnterpriseArchitect/ProcessDesigner model
- sys:eapdElement: QPR EnterpriseArchitect/ProcessDesigner element that exists in the defined QPR EnterpriseArchitect/ProcessDesigner model
- sys:metricsModel: QPR Metrics model
- sys:metricsScorecard: QPR Metrics scorecard that exists in the defined QPR Metrics model
- sys:metricsValueSettings: QPR Metrics value settings that exist in the defined QPR Metrics model
- sys:metricsElement: QPR Metrics element that uses the defined Metrics value settings
- sys:referenceDate: The date used to define which period is to be used in the view
- To define your own context variables and their values, type in the name of the variable to the text field and click the check mark. After that, you can click the value field and type in the value for your custom context variable.
- You can also define the following system context variable values that have an effect on the user interface:
- sys:hideViewHeader: Defines if the top main toolbar in the view is hidden ("true") or visible ("false")
- sys:showVersionNumbers Defines if the version number text in the top main toolbar of the view and the panel headers are visible ("true") or hidden ("false")
- The Behavior selection affects the context variable used in the view in the following way:
- Default: the value of the context variable will be inherited from the higher level, i.e. Session (defined via the Selections button) → View → Panel → Presentation object. If there is no value for the context variable on a higher level, the value defined here will be used.
- Fixed: the value of the context variable will overwrite any existing effective value of the same context variable.
The panel and presentation object properties also have the Context tab. If you want a panel or a presentation object to always have a specific context variable value regardless of what is selected for the session, view, or panel, define the context variable in the panel or presentation object properties, and set the Behavior of the context variable to "Fixed".
To see what context variable values are used in the view, panel, or presentation object, select the Show effective context check box in the Context tab of the view, panel, or presentation object properties pages.


Using QPR EnterpriseArchitect/Processdesigner Data
- To use EnterpriseArchitect/ProcessDesigner data, define the sys:eapdModel, sys:eapdElementType, and sys:eapdElement context variables to set the default context instance. With the sys:eapdElement context variable, you can use the check boxes on the left side of the list to select the elements to which the view you are designing applies. These elements will then be selectable as the context instance via the Selections button when browsing the view. Selecting the All elements automatically check box will result in all elements of the element type defined by the sys:eapdElementType variable to be automatically available in the view when new elements of that type are added to the model.
Using QPR Metrics Data

- If you want to show data from element(s) that reside in some particular scorecard(s), define the sys:metricsModel and sys:metricsScorecard context variables. This is the most commonly preffered way of showing Metrics data.
- If you want to show data from a single Metrics element or measure, define the sys:metricsModel, sys:metricsValueSettings, and sys:metricsElement context variables.
The difference between these two approaches is that views with the sys:metricsScorecard variable defined can show data from multiple measures residing in the selected scorecards, whereas views with the sys:metricsElement variable defined are restricted to the measures selected here, but they enable browsing different measures using the same value settings as the selected measure.- With the sys:metricsScorecard and sys:metricsElement variables, you can use the check boxes on the left side of the list to select the scorecards/elements to which the view you are designing applies. These scorecards/elements will then be selectable as the context instance via the Selections button when browsing the view. Selecting the All scorecards/elements automatically check box will result in all scorecards/elements of the model defined by the sys:metricsModel variable to be automatically available in the view when new scorecards/elements of the defined sys:metricsValueSettings type are added to the model.
Using QPR ProcessAnalyzer Data

- If you want to show ProcessAnalyzer data, define the desired custom context variables and their values into the text fields. Some suggested variables to use: FilterId, ModelId, AnalysisType, MaximumCount, SelectedActivities, and SelectedTransitions. See the Analysis Parameters page for a more complete listing of possible variables.
After defining the view properties and context, click the Close button to apply the changes and exit the view properties.
Select Period
By default, the QPR MobileDashboard view shows data from the Current period. As the view you are designing might not have data available for the current period, click the Selections button:

Then, select a period for which you have data:

Add a Panel and Define Panel Properties and Context
A View consists of one or multiple Panels that hold inside them Presentation Objects that show the actual data. Panels can be reused, i.e. it is possible to add Panels that you have in your Private Workspace or that have been published to the Public Workspace.
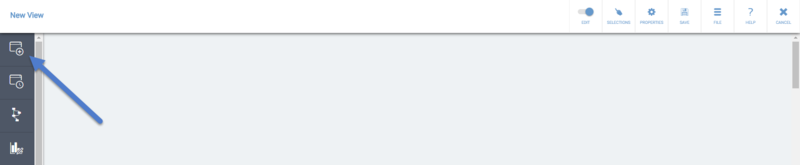
- Add a new Panel to the view by clicking the Add New Panel button in the side toolbar.
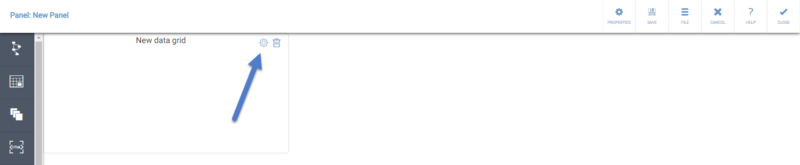
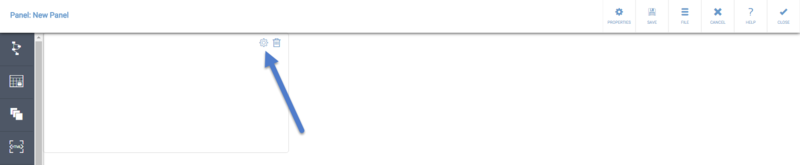
- Click the Edit button on the panel.
800px - To give a Name and a Description for the panel, open the panel properties by clicking the Properties button.
- In the Panel Properties, you can define the Name and Description on the Properties tab.
In addition to normal text, you can use context variables in the Name field, so that the value of the variable will be shown when the context variable has a value. To do this, type the context variable name in the format "{#contextvariablename}" For example, you could define the Name of the panel to be "Selected scorecard: {#sys:metricsScorecard}."
If the name contains context variable separator characters ({ or }) or an escape character (\), the characters need to be escaped by the backslash (\) character before them. For example, to have "my{0}\example" working properly, it needs to be entered as "my\{0\}\\example".
This same functionality is available in presentation object names too.
You can also define panel specific context variable values on the Context tab.
You can hide the panel header from the view by selecting the "Hide panel header" check box.
Apply the changes and close the panel properties by clicking Close.


Add a Data Grid
You can now add Presentation Objects to the panel by clicking the Presentation Object buttons on the side toolbar. All graphical Presentation Objects need either a Table or Data Grid Presentation Object containing data as their intermediate data source. Defining the contents of the Table and Data Grid Presentation Objects is similar, so in this tutorial we will use the Data Grid Presentation Object.
- Add a Data Grid Presentation Object to the panel by clicking the Data Grid Presentation Object button on the side toolbar.
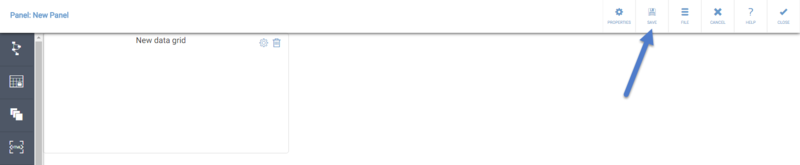
800px - This is a good point to save the Panel. Click the Save button on the toolbar on top.
- The Presentation Object Properties are used to define what data is used in the Data Grid and how the data is shown. Click the Edit button on the Data Grid Presentation Object to open the data grid properties.
- First, give a Name and optionally a Description for the data grid. Then click the Query tab.
800px


Defining the Query for Getting Data
- A query defines the element(s) from which attributes having values are taken. Click Add query to start defining a query, and then select either EnterpriseArchitect / ProcessDesigner, Metrics element, Metrics scorecard, or ProcessAnalyzer to be the initial data source.
800px- When querying EnterpriseArchitect / ProcessDesigner data, the first element that appears to the query is the sys:eapdElementType value that is defined in the Session or View/Panel/Presentation object Properties. Click on the Element and Connector types in the Side Pane until you have reached the desired Element Type from which you want to show data.
800px - When querying Metrics data, with Metrics scorecard, you can select the element residing in the scorecard defined by the sys:metricsScorecard context variable to be the element from which you want the query to take data.
With Metrics element, the first element that appears to the query is the element you selected as the sys:metricsElement context variable value.
Note that when the value of the context variables are changed, the initial element in the query will change too.
Metrics reference elements are shown with the format "Element name (Scorecard name)". When using a reference element, the data will always be taken from the selected reference element, regardless of what the currently selected scorecard is.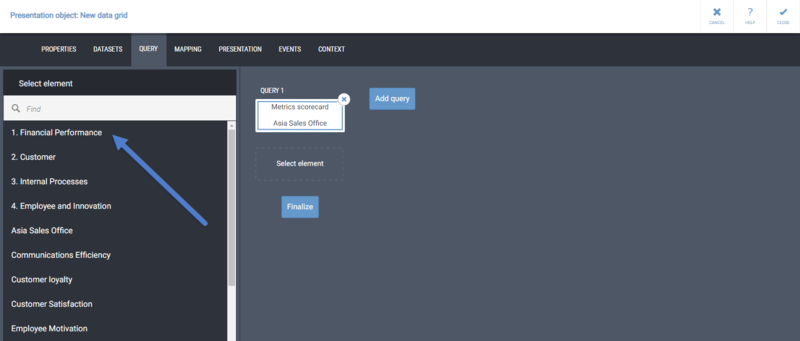
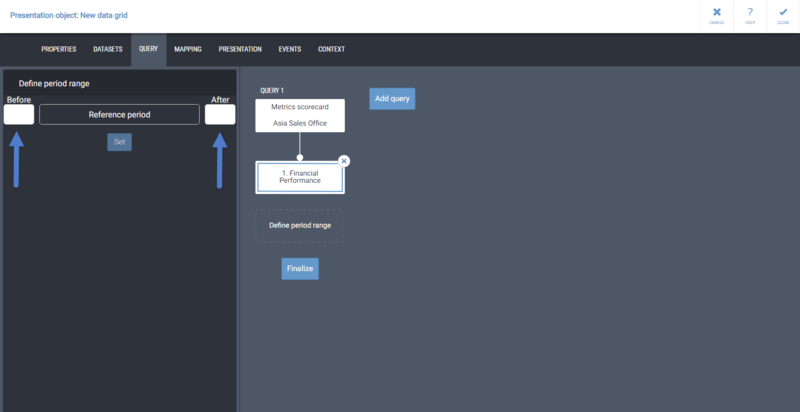
- When querying Metrics data, you can define the Period range, which defines how many periods are shown before and after the currently selected period in the view.
- When querying ProcessAnalyzer data, enter the Analysis Parameters to the text field and click Set.
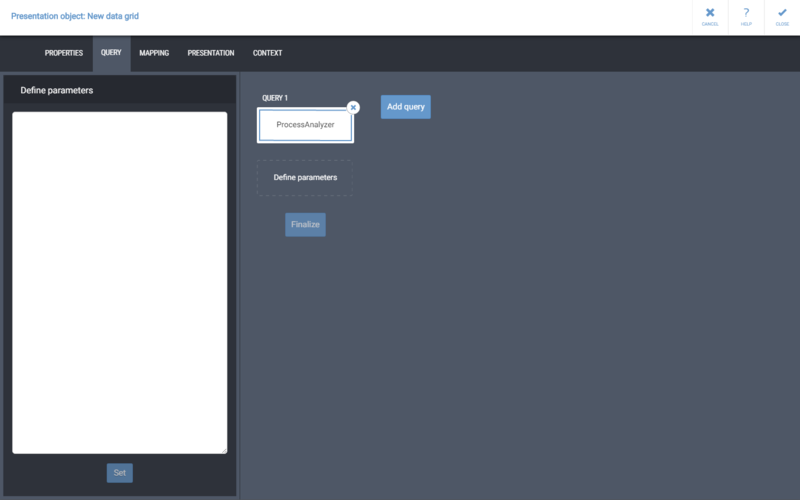
You can also use a ProcessAnalyzer bookmark by defining the analysis parameters as "ReportId=<Id of the Bookmark>" (without the quotes).
If the query contains context variable separator characters ({ or }) or an escape character (\), the characters need to be escaped by the backslash (\) character before them. For example: to have "my{0}=\\query\example.txt" working properly, it needs to entered as "my\{0\}=\\\\query\\example.txt"
Context variables can be used in the query by typing them in the format "{#contextvariablename}" (without the quotes). For example, you could define the "ModelId" analysis parameter to take the value from the "MyModelId" context variable by typing in "ModelId={#MyModelId}".
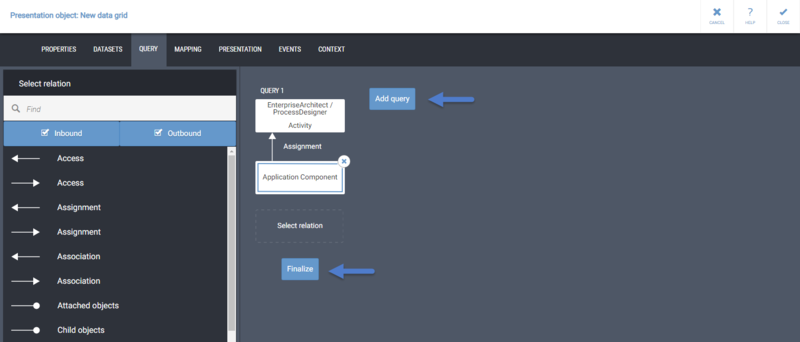
When using a bookmark, you can override the analysis parameters used in the bookmark by defining the needed parameters separately after the bookmark. - After reaching the wanted element (EA/PD), defining the period range (Metrics), or defining the analysis parameters (ProcessAnalyzer), click Finalize and give a name for the query result. The attributes from the result set will be selectable on the Mappings tab. If you want to add another query, click the Add query button.
- When querying EnterpriseArchitect / ProcessDesigner data, the first element that appears to the query is the sys:eapdElementType value that is defined in the Session or View/Panel/Presentation object Properties. Click on the Element and Connector types in the Side Pane until you have reached the desired Element Type from which you want to show data.


Mapping Query Results to the Data Grid
- Click the Mapping tab. On the Mapping tab, you select which attributes' values are shown in the table.
First, expand a Result Set by clicking it under Select attributes.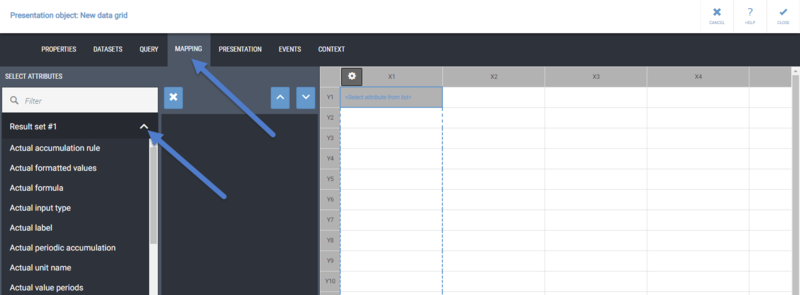
- Click on the Attribute Names on the Result Set list to add the attributes to the table. The whole rectangular area shown on the sheet is called a Mapping. The dotted line shown on the mapping on the sheet indicates where the next attribute will be placed in the table.
On the Mapping tab, the table will show only placeholders for the attribute values. Real values can be seen on the Presentation tab.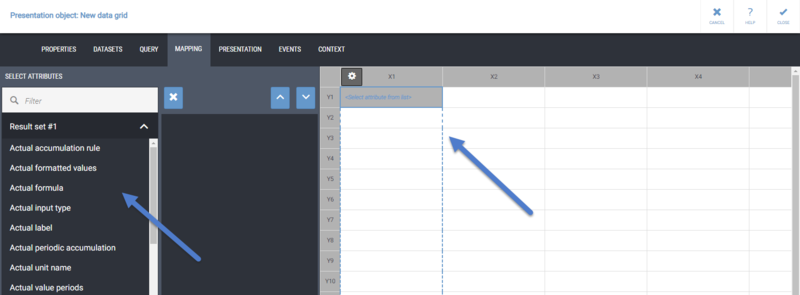
- A single mapping can have attribute values from only one result set defined on the Query tab. To add another mapping to the table, click a cell that doesn't have a mapping definition in it. To edit an existing mapping, click on a cell on that mapping.
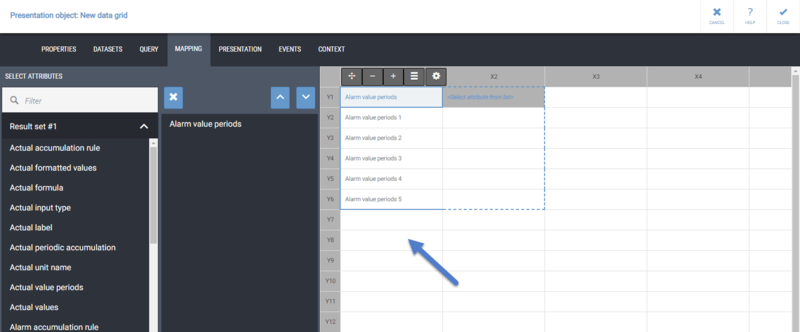
- To Move, set the Size and Direction, Hide or Show the Table Headers, or to Delete the mapping, click the Mapping Toolbar buttons shown on top of the mapping.
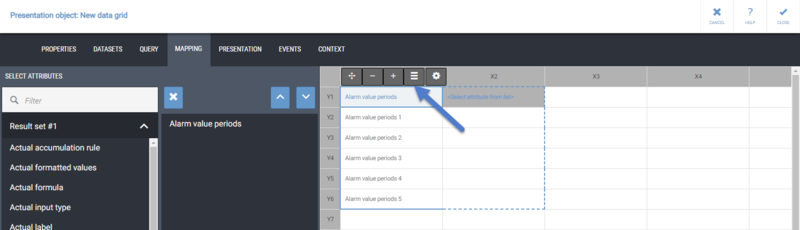
- Click the Cogwheel button to open the Cell Properties, and define some Text and the Link URL for the cell.
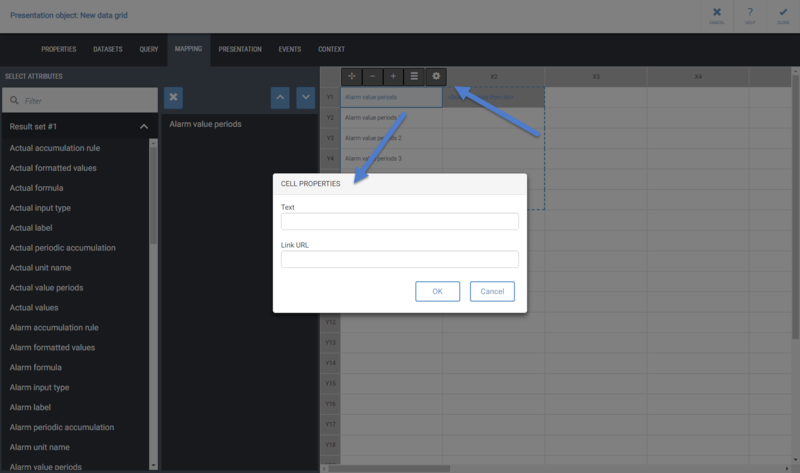
The Text in the Cell Properties will overwrite any value coming from a mapping, so that the value won't be shown in the table.
When the Link URL is defined, the cell will contain a hyperlink to the defined URL, and the link will be shown if you have defined the Text for the cell or if the table contains a value for that cell.
To link to a QPR MobileDashboard view, define the view with the "sys:dashboard" variable in the URL like this: "http://your.host.here/mobiledash/#/dashboard?sys:dashboard=<id of the target view>". You can also define values for the target view's context variables by appending "&variablename=<variablevalue>" to the URL, and utilize context variables as the value in the URL by adding them using the format "{#contextvariablename}". For example:
http://your.host.here/mobiledash/#/dashboard?sys:dashboard=8772&country=Finland&scorecard={#YourScorecardIdentifierVariable}.
If the QPR Suite Single Sign-on is in use, and you want to link to QPR Portal or QPR ProcessAnalyzer Web Client using the QPR Suite Single Sign-on, append a "&XSESSION={#sys:sessionId}" parameter to the end of the link URL, for example:
http://your.host.here/QPR2016-1/Portal/QPR.Isapi.dll?your-mea-parameters&XSESSION={#sys:sessionId}
Cells for which you have defined Cell Properties are marked with a triangle on the top right corner of the cell.


Defining the Presentation of the Data
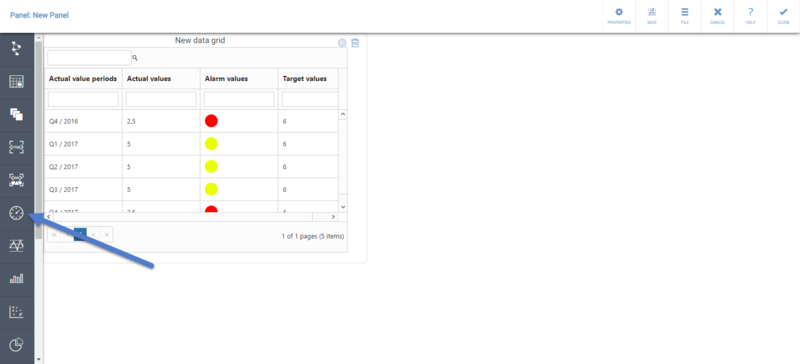
Click the Presentation tab to see how the table looks like with the real values from the attributes and the text you have defined in the Cell Properties. Cells for which you have defined Cell Properties are marked with a triangle on the top right corner of the cell. If you want to make changes, you can go back to the Mappings tab.
Adding Range Color Icons
To add Range Color Icons to the table:
- If the desired value settings are not available, create new value settings by clicking the New button and give a name for the value settings
800px
Then, add the desired amount of Range limits and then add Range(s) and define their properties.
800px
A range is an area defined by one or two range limit(s), and it is used to visualize and compare the values shown. For example, you might have a range called "Average" that has the range limit "Alarm" as its lower range limit and "Target" as its upper range limit. Values that fall between the two range limits are in the "Average" range. After you are done defining the new value settings, click Save. - Click a column header to select it.
800px - Select the value settings from the value settings list.
800px - Use the check boxes on the side of the table to select the rows to which the range color icons will be added.
800px - Use the Column Function buttons on top of the table to define which column contains the values and which one(s) are used for the range limit(s).
800px
A column that has range color icons defined is marked with a triangle on the top right corner of the header. The range color icons will cover the values shown on the column, so you can use for example the column containing 'Alarm' or 'Target' values to display the range color icons, if you don't want to show the values from that column in the table.
Formatting Values
To format the values in a column or row:
- Click a Column/Row Function button and select Format column/row.
- Select the Show numeric values as percentages check box to convert the decimal numbers into percentages.
- To limit the number of decimals, select the Number of decimals check box and define the number of decimals you wish to use.
- Select the Format cell background based on column values check box to make the cells have gradient background colors computed from the position of the value of each cell relative to the maximum and minimum values in the column or row.
To hide a column or row, select Hide column/row from the Column/Row Function buttons menu. A hidden column or row can be shown by selecting Show column/row from the Column/Row Function button menu.
Click Close to apply changes and exit the Presentation Object Properties. After defining the Data Grid contents, it's again a good idea to Save the changes to the panel.
Defining Pop-up Menu Actions
WORK IN PROGRESS On the Pop-up menu tab, it's possible to add a pop-up menu that can be opened by right-clicking the data grid. The pop-up menu is used to set values for context variables based on which cell was clicked, and to execute QPR ProcessAnalyzer queries. The definition is done as a JSON configuration string that is an array of context menu item objects. The context menu item object has the following properties:
- name: String. Mandatory. The name of the pop-up menu item.
- paQuery: String. Optional. The ProcessAnalyzer query to execute. Note that you need to use "\n" as linefeed in the string between the wanted ProcessAnalyzer query parameters.
- contextChanges: Object. Optional. The context changes object has a property for every context variable it sets. The value of the context variable property is an object with the following properties:
- value: String. To refer to a column in the data grid, use the following format: "{$column_name}", for example "{$country}"
- prettyValue: String
- behavior: String. Either "default" or "fixed". If the behavior property is missing, the value is set as "fixed".
Once you start entering the JSON, you will se an icon indicating whether the JSON you entered is valid or not. In case you have entered invalid JSON, you can't close the Data Grid properties.
Example
As an example, the following JSON defines a pop-up menu that runs a ProcessAnalyzer query, sets values for the context variables "country" and "city" from columns named "country" ("{$country}") and "city" ("{$city}") with fixed behavior and for the "columnIndex" context variable using the order number of the column.
[{
"name": "Select country",
"paQuery": "analysisType=5\nparam_Country={#Country}",
"contextChanges": {
"country": { "value": "{$country}", "behavior": "FIXED" },
"city": { "value": "{$city}", "behavior": "FIXED" },
"columnIndex": { "value": "{%columIndex}", "behavior": "FIXED" }
}
}]
Add a Gauge
You can now add a graphical presentation object to the panel.
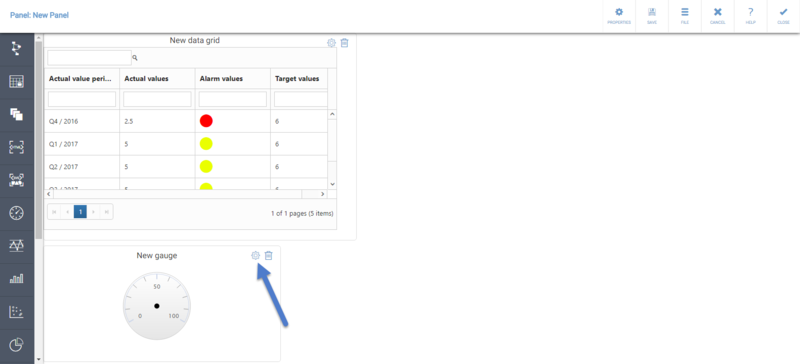
# Click the Gauge button on the side toolbar.
 # Click the Edit button on the gauge presentation object to open the gauge properties.
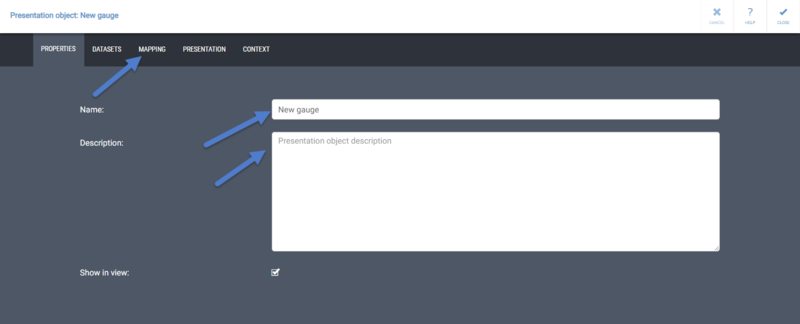
 # First, give a Name and optionally a Description for the gauge. Then click the Mapping tab.
 # Graphical presentation objects take their data from existing tables. Select a data grid from the Select Data Source list.
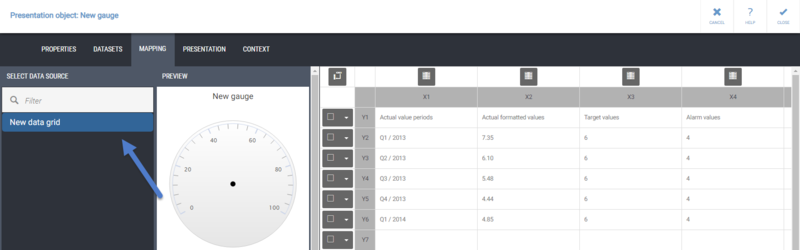 # Value settings define the ranges and range limits for the graphical presentation objects. To use existing value settings, select the desired value settings from the list on the bottom left corner. To define new value settings, click New and give a name for the value settings. Next, add the desired amount of Range limits and then add Range(s) and define their properties.
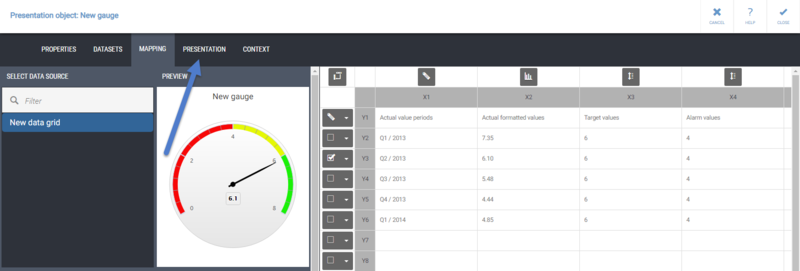
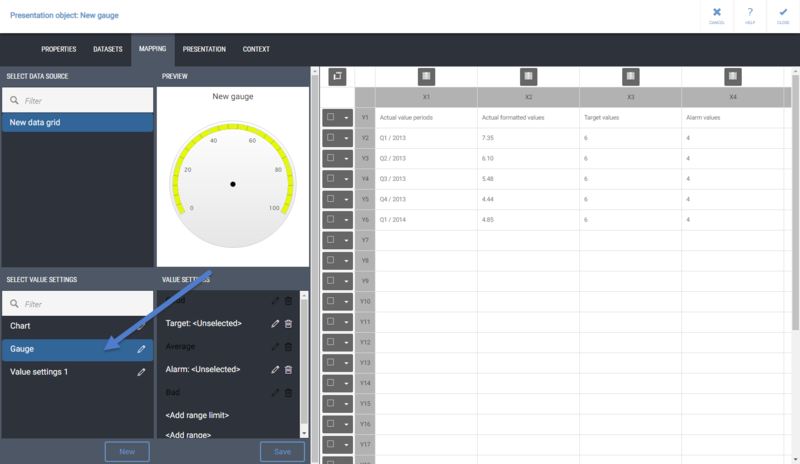 # Next, use the Column and Row Function buttons to define which row or column contains the Values, which row or column contains the Labels for the periods, which one(s) are used for the Series Labels, which one(s) are used for Range Limit(s), and which row or column to take All the values from.

These same kind of mapping steps are used in other graphical presentation objects too, but for example column charts can show multiple values, whereas a gauge is limited to showing only one value.
# The Preview shown on the Mapping tab acts as a reference when defining the ranges. To see a bigger preview click the Presentation tab.
 # On the Presentation tab, define the scale for the gauge by entering the Minimum and Maximum values to use on the gauge.
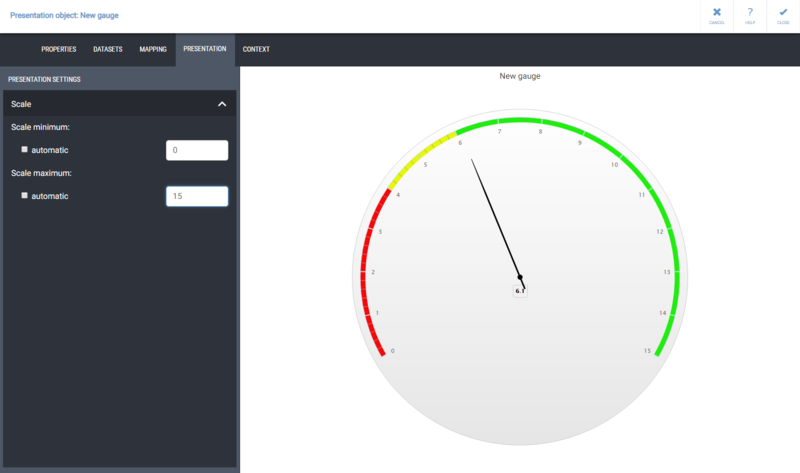
For other graphical presentation objects, expand the Presentation settings Values section to define the Ordering, Color, and Type of the series, and the Axis section to define the scale.
# After this, click Close to apply the changes and to close the presentation object properties. Then click Save to save the changes to the panel.
Showing Content from an External Web Page
To show content from some other website or web portal:
# Click the External Content presentation object icon.
330px
# Click the Edit button on the presentation object to open its properties.
 # Define the Name, Description, and the External content URL. In the Name and URL fields, you can use context variables by typing in the context variable name in the format "{#contextvariablename}".
# After defining these properties, click Close. The web page should now be visible:
# Define the Name, Description, and the External content URL. In the Name and URL fields, you can use context variables by typing in the context variable name in the format "{#contextvariablename}".
# After defining these properties, click Close. The web page should now be visible:
 Note that some sites prevent themselves to be embedded into other web sites and web applications like QPR MobileDashboard.
Add a Pushbutton
When a user clicks a Pushbutton presentation object, the QPR ProcessAnalyzer query defined for the Pushbutton is run, and the results are set as session context variable values. This enables changing, for example, the model and analysis type of the QPR ProcessAnalyzer analysis that is shown in the view.
To add a Pushbutton:
# Click the Pushbutton presentation object icon.
800px
# Click the Edit button on the presentation object to open its properties.
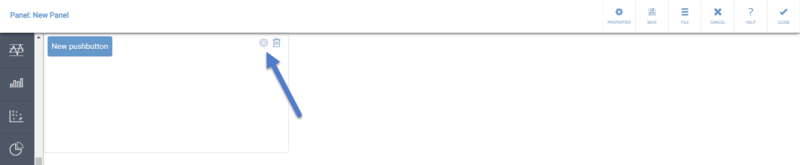 # Define the Name for the pushbutton. The name will be used as the label on the button. Optionally, give a Description for the pushbutton.
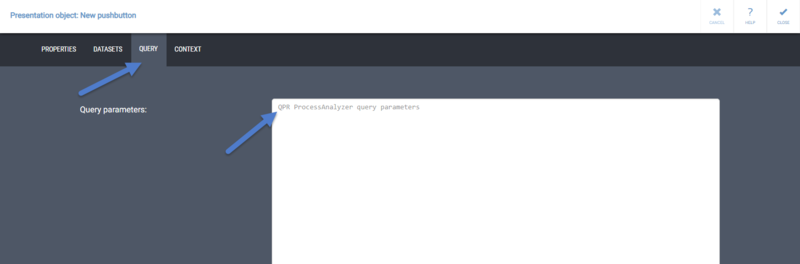
# Switch to the Query tab, and define the QPR ProcessAnalyzer query parameters.
# Define the Name for the pushbutton. The name will be used as the label on the button. Optionally, give a Description for the pushbutton.
# Switch to the Query tab, and define the QPR ProcessAnalyzer query parameters.
 # Optionally, you can also define context variables for the Pushbutton on the Context tab.
# Click Close to close the pushbutton properties, and then Save the changes.
# Optionally, you can also define context variables for the Pushbutton on the Context tab.
# Click Close to close the pushbutton properties, and then Save the changes.
Add a Pivot Grid
A Pivot Grid is a presentation object that gets its data from a data grid or a table.
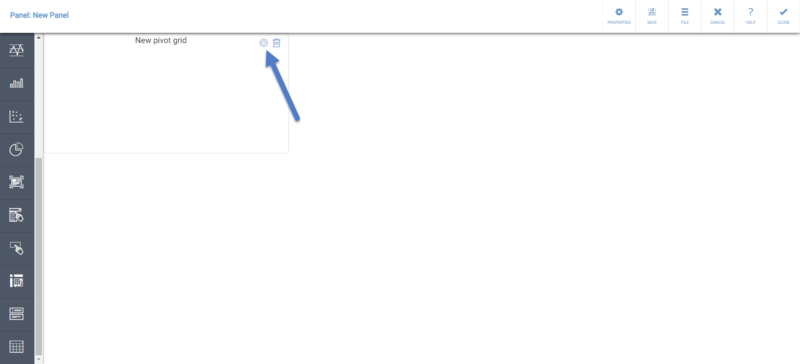
# Add a Pivot Grid Presentation Object to the panel by clicking the Pivot Grid presentation object button on the side toolbar.
800px
# Click the Edit button on the Pivot Grid Presentation Object to open the pivot grid properties.
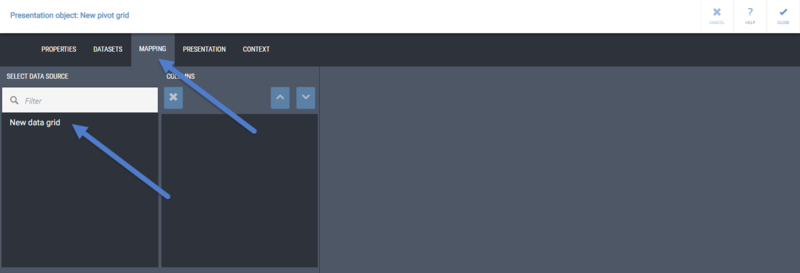
 # After defining the Name and possibly a Description for the Pivot Grid, switch to the Mapping tab. On the Mapping tab, select a table or a data grid to be the data source for the Pivot Grid.
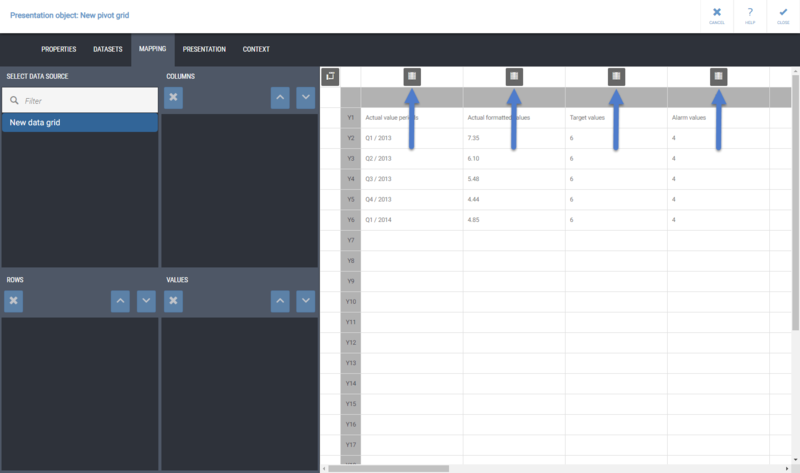
 # Use the buttons shown on top of the data table/data grid columns to map the columns to Rows, Values, and/or Columns.
You can switch to the Presentation tab to see how your Pivot Grid looks like when doing the mapping.
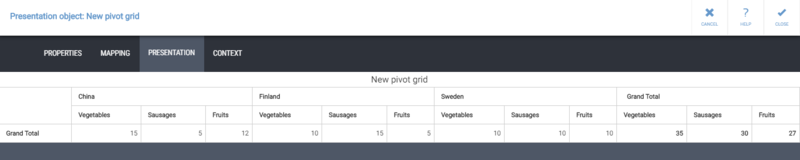
After you are satisfied, click Close to close the Pivot Grid Properties and again Close to close the panel. Then Save the panel.
Add a Pick List
Using a Pick list presentation object, you can change the value of a context variable to a predefined value, and run a QPR ProcessAnalyzer query much like with a Pushbutton. The difference to the Pushbutton is that with a Pick list, the context variable value can be selected from multiple options that come from a table or a data grid.
# Add a Pick list Presentation Object to the panel by clicking the Pick list Presentation Object button on the side toolbar.
800px
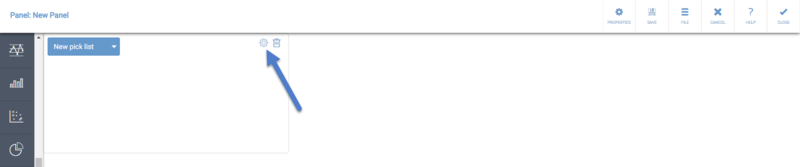
# Click the Edit button on the Pick list Presentation Object to open the Pick list properties.
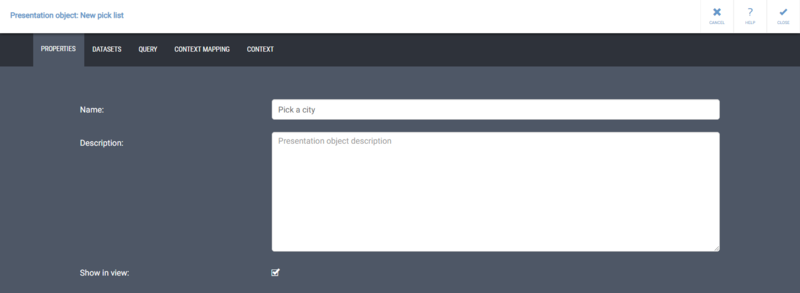
 # Define a Name and optionally a Description for the Pick list. The name will be shown on the Pick list button when nothing has been selected from the Pick list yet.
 # Switch to the Query tab. On the Query tab, you can define a QPR ProcessAnalyzer query to be executed when a selection is made on the Pick list. The query will be executed after the context variable value defined on the Context Mapping tab is set by the Pick list. Defining the QPR ProcessAnalyzer query is optional. If you don't define the query, only the context variable value will be set.
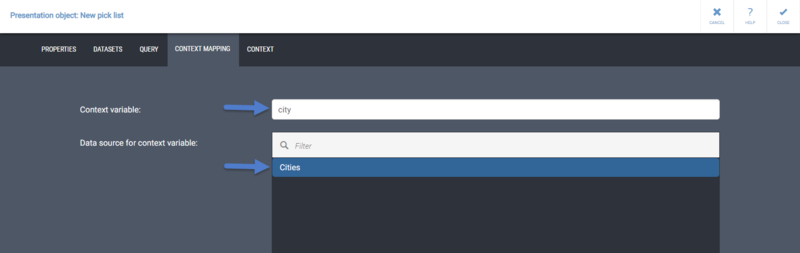
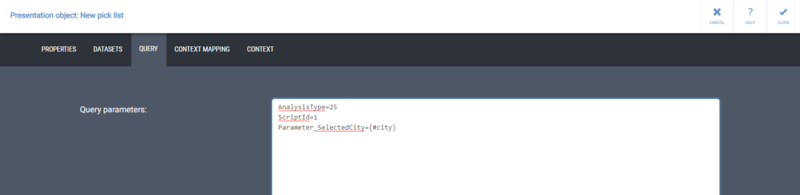 # Switch to the Context Mapping tab. On the Context Mapping tab, define the Context variable for which you want to set a value, and then select the table or data grid from which the context variable will take the possible values. The values will be taken from the leftmost column of the table or data grid, and the first row of the table or data grid is considered a header, so data on the first row won't be regarded as a possible value.
 # After you are satisfied, click Close to close the Pick list Properties, and then click Save to save the changes to the panel.
Add a QPR ProcessAnalyzer Presentation Object
# Add a QPR ProcessAnalyzer Presentation Object to the panel by clicking the QPR ProcessAnalyzer Presentation Object button on the side toolbar.
800px
Note that the QPR ProcessAnalyzer Presentation Object is available only if the QPR ProcessAnalyzer Web Service endpoint has been defined in your QPR MobileDashboard installation.
# By default, the QPR ProcessAnalyzer Presentation Object will show the flowchart analysis based on the default filter for the user. To change this, the FilterId context variable needs to be defined.
We'll define the FilterId in the View context, so that it will be available when the view is opened. First, click Close to close the panel.
# The View context is accessible in the View properties. Click the Properties button and then switch to the Context tab.
# Type in "FilterId" to the Variable name text box and then click the check mark.
# Tap the Value section on the FilterId row and input the desired FilterId value there, and then tap the check mark. The Behavior can be left as "Default", so that if the FilterId value is changed in the session context, the flowchart will update accordingly.
You can also define some additional context variable values that are used by the QPR ProcessAnalyzer Presentation Object. See the QPR ProcessAnalyzer in QPR MobileDashboard page for a list of the available QPR ProcessAnalyzer Presentation Object context variables. After you are done, tap Close to apply the changes.
# Click the Save button on the toolbar on top to save the view. Saving a view will also save any unsaved changes to the panels in the view.
800px


