Clustering Analysis: Difference between revisions
No edit summary |
|||
| Line 13: | Line 13: | ||
* '''Total density %''': Share of cases having this feature in the entire eventlog, i.e., the total number of cases having the value shown on the row divided by the total number of cases * 100. | * '''Total density %''': Share of cases having this feature in the entire eventlog, i.e., the total number of cases having the value shown on the row divided by the total number of cases * 100. | ||
* '''Contribution %''': Explains how much more common this feature is in this cluster when comparing to the entire eventlog. The higher the value, the more the feature characterizes this particular cluster. The contribution percentage is calculated as a subtraction of the cluster density and the total density percentages. | * '''Contribution %''': Explains how much more common this feature is in this cluster when comparing to the entire eventlog. The higher the value, the more the feature characterizes this particular cluster. The contribution percentage is calculated as a subtraction of the cluster density and the total density percentages. | ||
Note that in some special datasets, there may be less clusters returned than requested. This occurs for example when there are less cases than clusters requested, or the features of the cases don't have unique enough values. | |||
== Clustering Analysis Settings == | == Clustering Analysis Settings == | ||
Revision as of 12:08, 31 July 2023
Clustering Analysis can be used to explain what kind of cases the eventlog contains. It divides cases into groups in a way that cases within each group are as similar as possible in terms of the case attribute values and occurred event types. Clustering is based on a unsupervised machine learning and uses the kmodes algorithm with categorized values for case attribute values and event type occurrences. Due to the nature of the algorithm, different clustering runs may end up to different results. Also, the clustering is usually not performed for all cases but a sample of cases (to improve performance) because when the sample is representative, it would provide as good results as with the entire dataset. See this Wikipedia article for more about the idea behind clustering.
Clustering analysis is an easy way to understand and explain the eventlog without knowing anything about it beforehand. It can also be used to check data integrity, as the analysis might reveal that the eventlog actually contains data from two distinct processes that cannot actually be compared to each other.
Using Clustering Analysis
Clustering analysis is available as a view in the Navigation menu. Also when creating a custom dashboard, the clustering can be opened as a preset to get it to the dashboard. The dashboard will remember the clustering settings if they are changed.
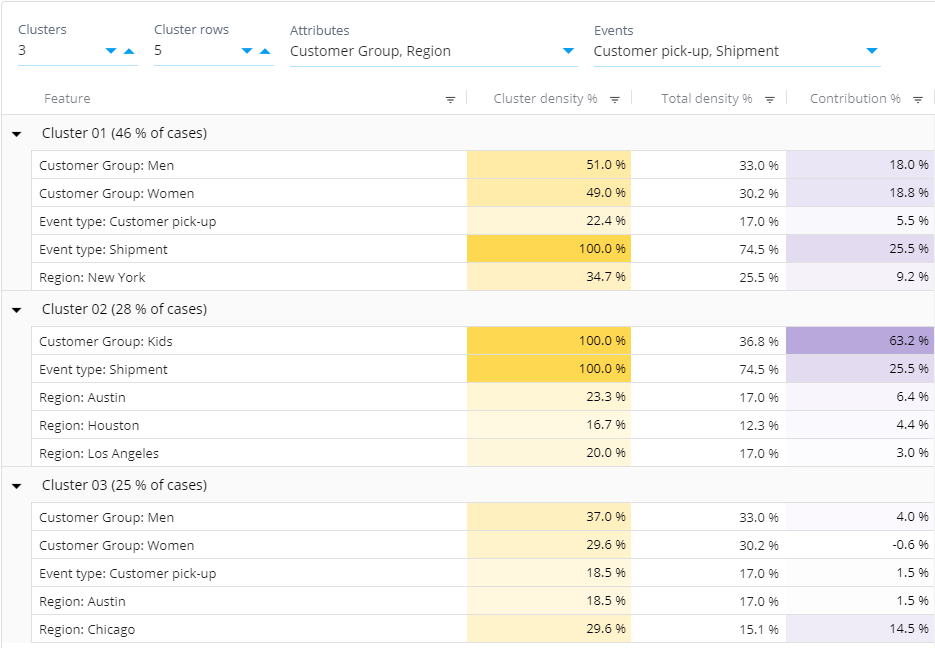
Clustering analysis is shown in a table where rows are grouped in a way that each group is a cluster and each row shows describing features in the cluster. There are the following columns:
- Feature: The describing feature of the cluster, i.e., the case attribute and its value, or the occurred event type name.
- Cluster density %: Share of cases having this feature within the cluster, i.e. the number of cases having the value shown on the row in this particular cluster divided by the number of cases in the cluster * 100.
- Total density %: Share of cases having this feature in the entire eventlog, i.e., the total number of cases having the value shown on the row divided by the total number of cases * 100.
- Contribution %: Explains how much more common this feature is in this cluster when comparing to the entire eventlog. The higher the value, the more the feature characterizes this particular cluster. The contribution percentage is calculated as a subtraction of the cluster density and the total density percentages.
Note that in some special datasets, there may be less clusters returned than requested. This occurs for example when there are less cases than clusters requested, or the features of the cases don't have unique enough values.
Clustering Analysis Settings
Clustering analysis has the following settings:
- Clusters: Number of clusters which the cases are divided into.
- Cluster rows: Number of describing features shown for each cluster. The features are shown in the order of strongest contribution.
- Attributes: Case attributes that are taken to the clustering analysis. If none is selected, all case attributes are selected. You can restrict which case attributes are selected, if you want the clustering to be done based on only certain features.
- Events: Event types that occurrences are taken to the clustering analysis. If none is selected, all event types are selected.
Also the size of the sample used in the clustering can be changed in the chart settings (in the Analyze tab).
Clustering Analysis Calculation
Calculating the clustering analysis is performed as follows:
- Taking a random sample of cases from the entire eventlog.
- Performing the clustering to the cases using the K-means algorithm. As a result, each case belongs to a certain cluster.
- Root causes analysis is run to find the characterizing features for each clusters.
The root causes analysis is used so that the clustering analysis wouldn't need show the individual cases in each cluster, but the features that describe each cluster (a long list of individual cases wouldn't be very easy to read). Note that the case attribute and event type settings are used both in determining which features are taken to the clustering phase and also for which features the root causes analysis is run.
