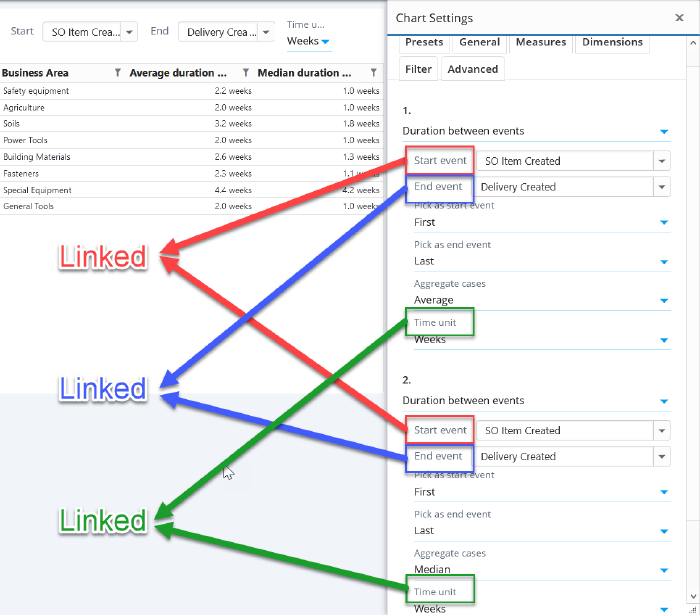
Chart Linked Settings
Chart linked settings are used to bind together selected settings in a chart, that will make sure the bound settings have always same values. The settings are defined to a linked settings group, and when any of the linked settings is changed, other linked settings in the same group are also changed automatically.
Usage
Tips when creating linked settings:
- Finding the correct technical setting name requires to investigate the chart settings json (in the Advanced tab). The label names in the settings dialog are different than the technical names that need to be used in the linked settings.
- Make sure to bind only settings that are of same data type. For example, trying to bind string and integer settings will likely not work. An an exception, it's possible to bind string array and individual string values, because the individual values are automatically converted into arrays.
- It's possible to define as many linked settings to the group as needed. Obviously, there needs to be at least two settings in the group, for the linked settings to work meaningfully. There can also be as many linked setting groups in the same chart as needed.
- Measures, dimensions and columns cannot be changed using the linked settings, but their parameters can be bound to linked settings.
- Dashboard variables are available in custom expressions by using tags (syntax: <#tagName>), which does not require linked settings.
Configuration
Linked settings are configured in the Advanced tab of chart/flowchart by clicking Linked settings. Linked settings json consists of setting groups which are array of objects. Each object points to an individual setting and it has the following properties:
- type: One of the following type of setting:
- measure: For measure parameters.
- dimension: For dimension and column parameters.
- eventtypemeasure: For flowchart event measure parameters.
- flowmeasure: For flowchart flow measure parameters.
- root: For analyzed objects parameters.
- generic: For other settings in the chart, such as Maximum rows (technical name: maxRows), Visualization (technical name: maxRows), Show Data Labels (technical name: datalabels), Model (technical name: modelId), etc.
- tag: For binding to a tag. Tags can be used in the custom expressions.
- variable: For binding to a dashboard variable. Dashboard variables can be used to bind together settings across multiple charts. Linked settings need to be defined for all the bound charts.
- filtervalue: For binding to filter rule parameters, such as case/event attribute values or event types.
- filterattribute: For binding to case or event attribute name in filter rule.
- index: Defines the order number (starts from 0). Used hen type is a measure, dimension, eventtypemeasure, flowmeasure, or filtervalue.
- parameter: Name of the chart setting or parameter.
- tagName: When type is tag, defines the bound tag name. The tag can be used in custom expressions similar to variables with syntax <#MyTagName>. Linking to tags is one-way: when a setting is changed, the tag is changed accordingly. On the other hand, the tag value itself cannot be changed directly.
- variableName: When linked setting type is variable, defines the variable name. Linking to variables is two-way: when a variable value is changed, the other linked setting is changed accordingly, and when the other setting is changed, a linked variable value is changed accordingly.
- filterGroupType: When type is filtervalue or filterattribute, defines the filter group type as one of the following: IncludeCases, ExcludeCases, IncludeEvents, ExcludeEvents, IncludeEventTypes, ExcludeEventTypes.
- filterRuleType: When type is filtervalue or filterattribute, defines the filter rule type as one of the following: CaseAttributeValue, EventAttributeValue, Attribute, EventType, Case.
- attribute: When type is filterattribute, defines the attribute name. Used for filter rule types CaseAttribute, EventAttribute and Attribute.
- expressionCategory: When type is filtervalue or filterattribute, and referring to a measure/dimension/column level filter, defines the measure/dimension/colum as one of the following: measure, dimension, eventtypemeasure, flowmeasure. When the expressionCategory is not defined, the linked setting refers to a chart level filter rule.
Examples
Measure and dimension parameters
[
	[
		{
			"type": "measure",
			"index": 0,
			"parameter": "Start event"
		},
		{
			"type": "measure",
			"index": 1,
			"parameter": "Start event"
		}
	],
	[
		{
			"type": "measure",
			"index": 0,
			"parameter": "End event"
		},
		{
			"type": "measure",
			"index": 1,
			"parameter": "End event"
		}
	],
	[
		{
			"type": "measure",
			"index": 0,
			"parameter": "Time unit"
		},
		{
			"type": "measure",
			"index": 1,
			"parameter": "Time unit"
		}
	]
]
Analyzed objects parameters
This example binds together Analyzed objects parmeter Start event with similar parameter of a measure.
[
	[
		{
			"type": "root",
			"parameter": "Start event"
		},
		{
			"type": "measure",
			"index": 0,
			"parameter": "Event"
		}
	]
]
Generic settings
This example binds together the Maximum rows and Analyzed objects sample size settings.
[
	[
		{
			"type": "generic",
			"parameter": "rootSampleSize"
		},
		{
			"type": "generic",
			"parameter": "maxRows"
		}
	]
]
Filter rules
This example binds dimension's filter rule (which type is cases going through event types) to the same dimension's parameter.
[
	[
		{
			"type": "filtervalue",
			"expressionCategory": "dimension",
			"index": 0,
			"filterGroupType": "IncludeCases",
			"filterRuleType": "EventType"
		},
		{
			"type": "dimension",
			"index": 0,
			"parameter": "Event"
		}
	]
]
Dashboard variables
This example binds Maximum rows setting to dashboard variable MaxItems. If several charts use the same variable, settings can be bound across several charts.
[
	[
		{
			"type": "variable",
			"variableName": "MaxItems"
		},
		{
			"type": "generic",
			"parameter": "maxRows"
		}
	]
]
Custom expression tags
This example binds tag named CaseAttributeName to a measure parameter to select the case attribute. The tag <#CaseAttributeName> can be used an all custom expressions of this chart.
[
	[
		{
			"type": "tag",
			"tagName": "CaseAttributeName"
		},
		{
			"type": "measure",
			"index": 0,
			"parameter": "Attribute"
		}
	]
]
