Process Discovery Analysis View
There are four ways to use the Process Discovery Analysis View (right view)
- Using default analysis elements from the header tabs
- Using presets
- Creating your own ChartView analysis elements
- Creating custom KPIs with ExpressionLanguage
Default analysis elements from the header tabs
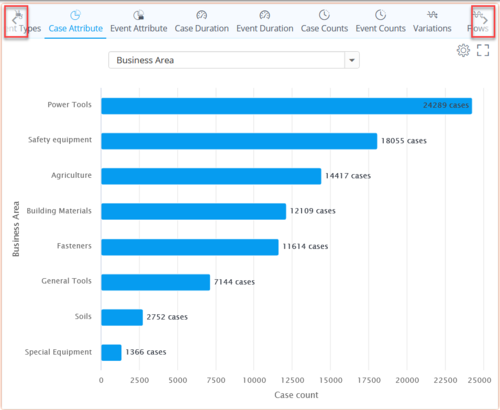
You can use the default analysis elements by browsing the header tabs on top of the ChartView. You can see more options by clicking on the left and right arrows. Each type of analysis is explained below.
Cases
- Case ID: The individual identifier assigned to a case.
- Case start: Time stamp of the first event of the case.
- Case end: Time stamp of the last event of the case.
- Case duration: End-to-end duration from the first event of the case to the last event of the case.
- Latest event: Last event in the chain of events of the case.
- Events: Count of event occurrences in the case.
- Event types: Count of event types in the case.
Events
- Case ID: The individual identifier assigned to a case.
- Event type: Name of the event.
- Event time: Time stamp of the event.
- Duration from case start: Duration between the event and the first event of the case.
- Duration from previous event: Duration between the event and the event preceeding it.
- Event order number: Sequence/index number of the event within the case.
Event Types
- Event type: Name of the event.
- Cases: Count of cases containing the event type.
- Events occured: Event count of the event type in all (filtered) cases.
- Incoming flows: Number of event types directly preceeding the event type within the selected cases.
- Outgoing flows: Number of event types directly following the event type within the selected cases.
- Events per case: Events occurred / Cases.
Case Attribute profiling
Case Attribute profiling visualizes the break down of the case count according to Case Attribute values. You can choose different Case Attributes to analyze by toggling the drop down menu. The Visualization defaults to bar chart which you can change from the "General" tab of the Chart Settings.
Event Attribute Profiling
Event Attribute profiling visualizes the break down of the event count according to Event Attribute values. You can choose different Event Attributes to analyze by toggling the drop down menu. The Visualization defaults to bar chart which you can change from the "General" tab of the Chart Settings.
Case duration analysis
Case duration analysis breaks down the case count according to the duration of the cases within the (filtered) dataset. You can choose the granularity of the case durations from the dropdown menu. The Visualization defaults to column chart which you can change from the "General" tab of the Chart Settings.
Event duration analysis
Event duration analysis breaks down the flow duration between two selected events. You can choose the analysis target by either:
- Selecting a flow from the flowchart.
- Toggling the "Start" and "End" drop down menus and selecting the desired events.
You can choose the granularity of the event durations from the "Time unit" dropdown menu. The Visualization defaults to column chart which you can change from the "General" tab of the Chart Settings.
Case counts
Case Counts analysis breaks down the Case Count based on the starting time of the (filtered) cases in the data. You can choose the granularity of the time periods from the "Period" drop down menu. The Visualization defaults to column chart which you can change from the "General" tab of the Chart Settings.
Event counts
Event Counts analysis breaks down the Event Count based on the starting time of the (filtered) Events in the data. You can choose the granularity of the time periods from the "Period" drop down menu. The Visualization defaults to column chart which you can change from the "General" tab of the Chart Settings.
Variations
Variations analysis aggregates Case Counts of identical process flows and sorts them in a descending order of Case Count. When Events in case > Event types in case, there is rework and/or looping in the process.
- Cases: Count of cases containing the specific process flow variation
- Average duration: Average duration of the specific process flow variation
- Events in case: Count of occurred events in the process flow variation
- Event types in case: Count of event types in the process flow variation
Flows
Flows analysis aggregates all start event to end event flows and sorts them in a descending order of Average duration of the flows.
- Start: Name of the start event of the flow.
- End: Name of the end event of the flow.
- Average duration: Average duration of the flow.
- Median duration: Median duration of the flow.
- Cases: Count of cases which contain the flow.
- Occurrences: Count of flow occurrences.
- Looping: Looping percentage (repetition per case count). Calculated as (Occurrences / Cases - 1) * 100.
- St.dev.: Duration standard deviation of the flow.
Root causes
To be updated
Clustering
To be updated
Using presets
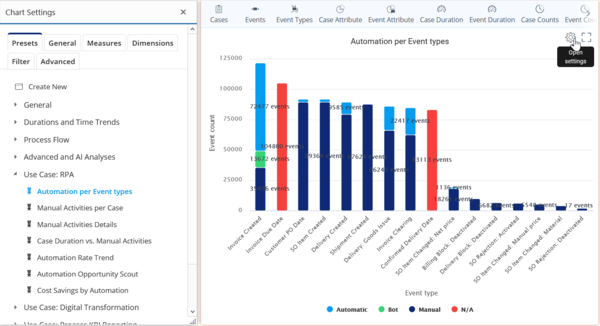
You can expand your selection of analyses to 50+ pre-made presets. To open the presets you need to:
- Click on the ChartView area
- Click on the cog on the top-right corner to open the Chart Settings
- Select you preferred analysis from the use cases in the "Presets" tab

